Using Grafana / Prometheus with StoredSafe
Note
Health metrics via SNMPv3 are available from StoredSafe versions later than 4.1.0 (build 7120).
Background
StoredSafe exposes metrics via SNMPv3 using Net-SNMP extend
(NET-SNMP-EXTEND-MIB). Monitoring access is read-only and performed by SNMP polling.
Note
StoredSafe requires SNMPv3 with authPriv for all metrics access. Unauthenticated or unencrypted SNMP is not supported, as operational metrics may expose sensitive system state and health information.
SNMPv1, SNMPv2c, and SNMPv3 without privacy (authNoPriv) are not supported.
StoredSafe publishes metrics as plain text in the format:
key value
All values are numeric.
Recommended SNMP object
StoredSafe exposes the same metrics through two SNMP objects:
Recommended (one metric per line)
MIB:
NET-SNMP-EXTEND-MIBObject:
nsExtendOutLineExtend name:
metrics
This returns one line per metric and is the easiest format to consume from monitoring systems.
Compatibility / debugging (single blob)
MIB:
NET-SNMP-EXTEND-MIBObject:
nsExtendOutputFullExtend name:
metrics
This returns a single multi-line string (newline separated).
Why a “bridge” is needed
Prometheus and Grafana work best with numeric time-series metrics (gauges/counters). SNMP extend returns text values, so customers typically deploy a small “bridge” that:
polls SNMPv3
extracts numeric values from the returned text
exposes them as Prometheus metrics for Grafana dashboards and alerting
StoredSafe is responsible for exposing metrics via SNMP only. All collection, transformation, storage, and alerting logic is external.
StoredSafe does not initiate outbound connections for monitoring purposes.
Reference implementation: storedsafe-monitoring
Rather than building the bridge described below from scratch, AB StoredSafe publishes a
ready-made reference stack at github.com/storedsafe/storedsafe-monitoring. It includes example Prometheus
and snmp_exporter configuration, pre-built Grafana dashboards, and example Prometheus
alert rules — all running outside the StoredSafe appliance, same as any bridge you would
build yourself.
Note
This is a reference implementation and starting point, not a supported monitoring product and not required to operate StoredSafe. StoredSafe does not depend on Prometheus, Grafana, or any specific monitoring stack.
It ships with three pre-built Grafana dashboards:
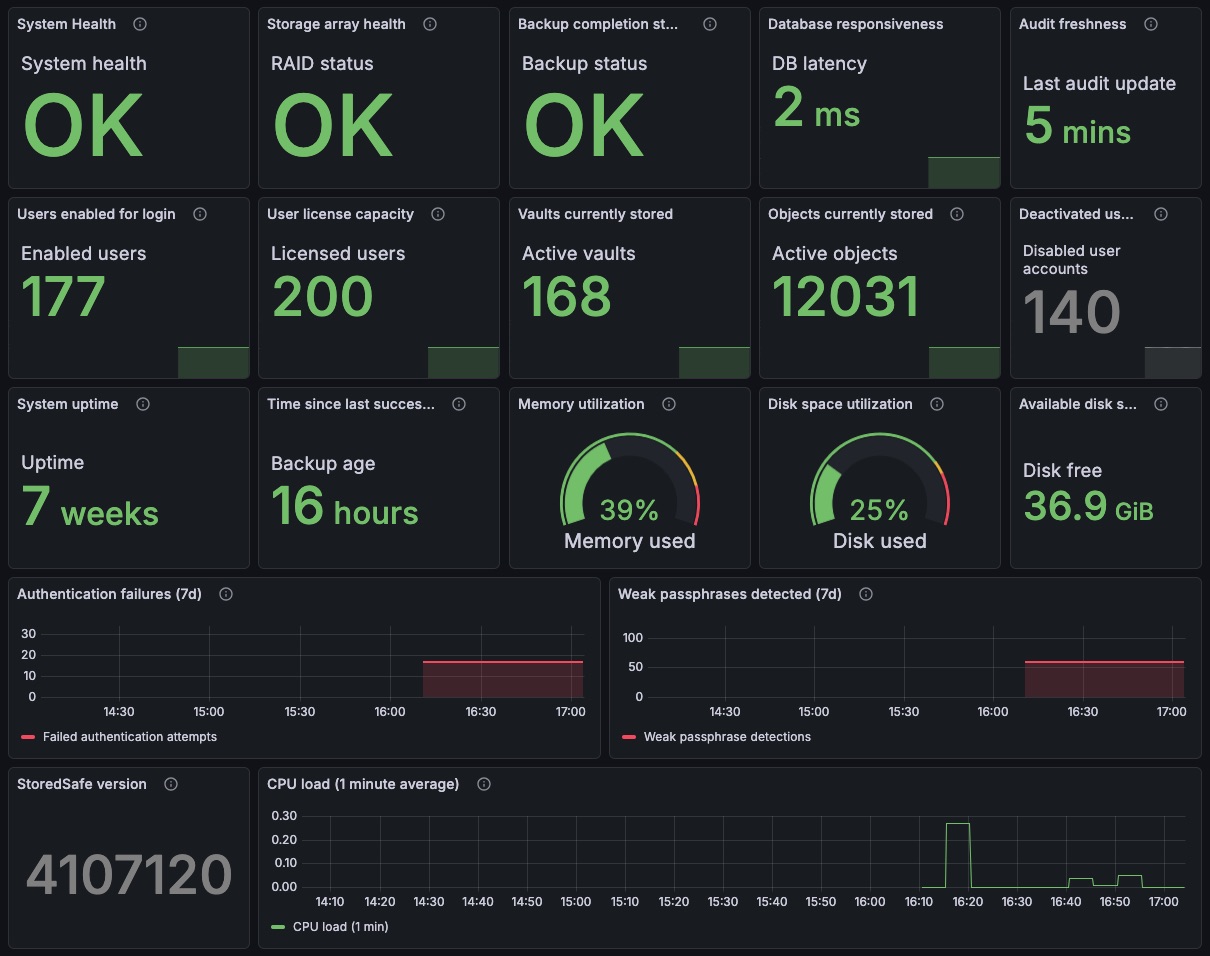
Operational health — uptime, CPU/memory/disk, RAID status, backup and audit freshness.
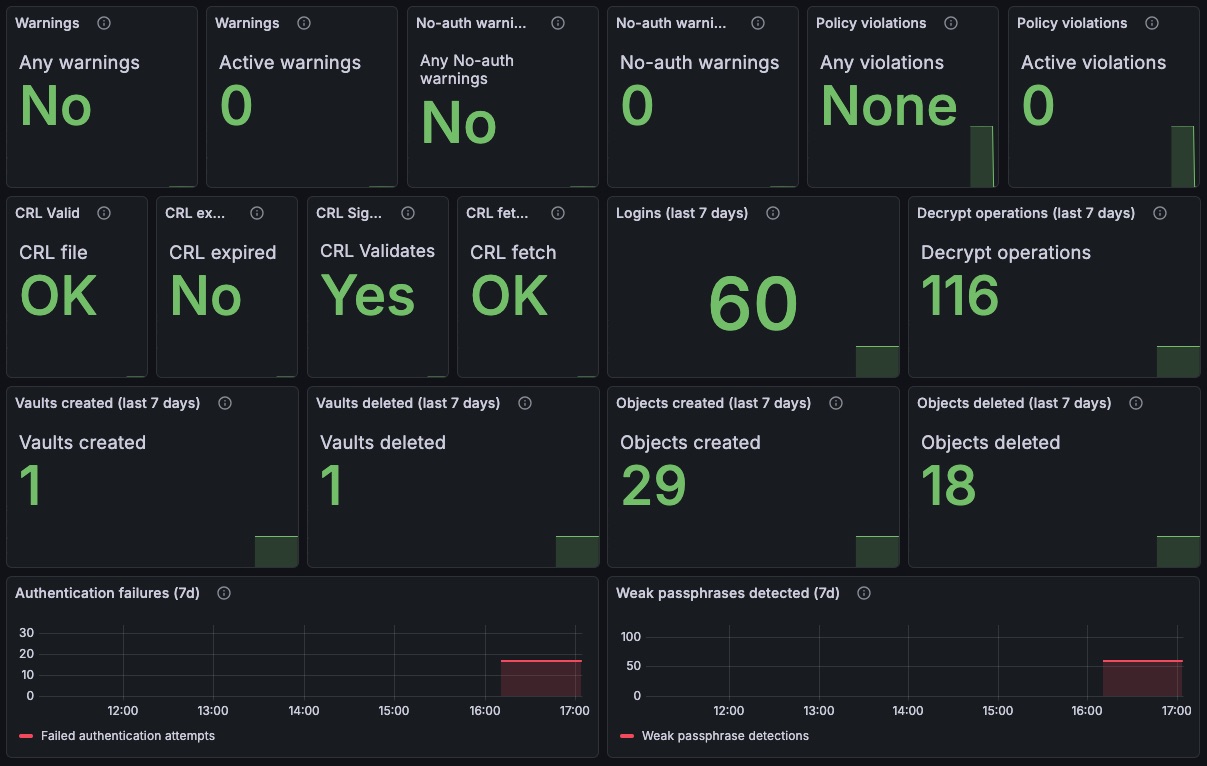
Security and policy compliance — auth failures, weak passphrases, mTLS/CRL warnings.
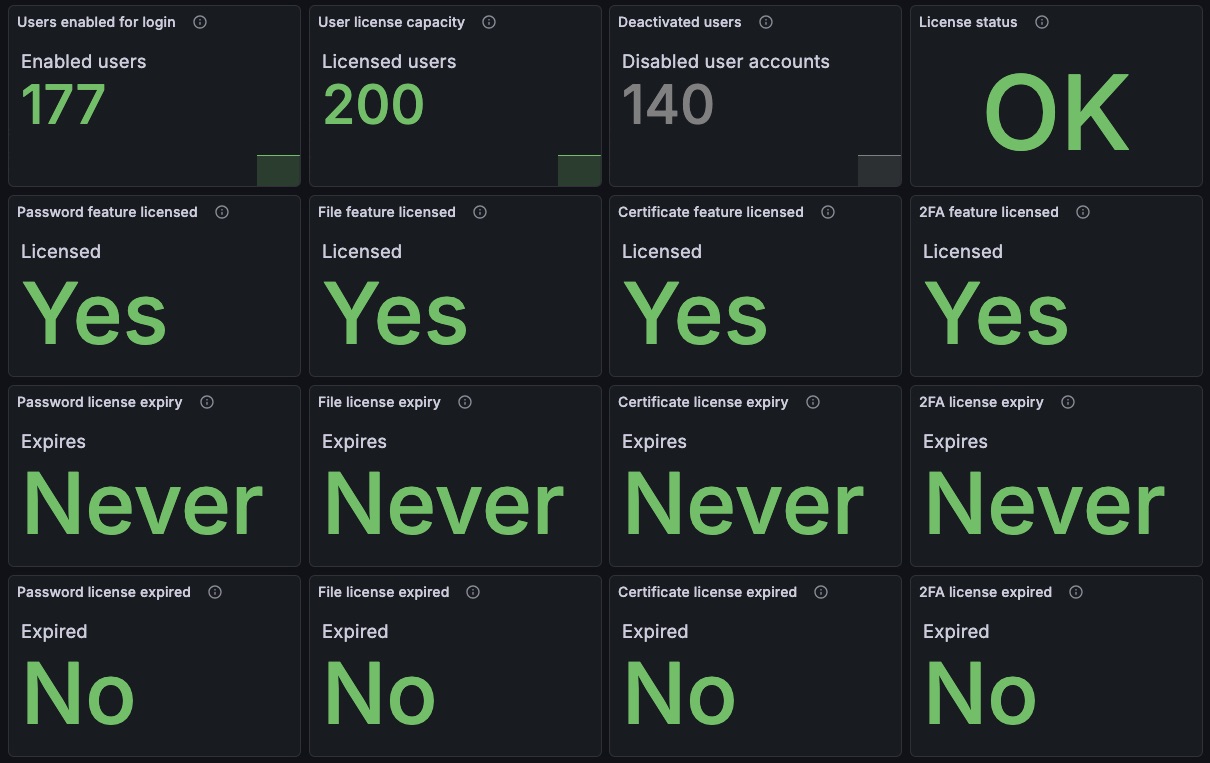
Licensing and administrative state — license expiry and user/vault counts vs. license.
If you’d rather build your own bridge instead of using the reference stack, the rest of this page describes the underlying mechanics.
Option A (recommended): Prometheus + snmp_exporter
Prometheus snmp_exporter is commonly used to poll SNMP targets (including SNMPv3)
and expose the result as Prometheus metrics.
Polling and metric mapping
StoredSafe does not expose native Prometheus metrics. Instead, metrics are returned as plain text via SNMP extend and must be translated by the polling component.
Each returned line contains a single metric in the format:
key value
The polling component (for example snmp_exporter) is responsible for:
polling
nsExtendOutLine."metrics"via SNMPv3extracting the numeric value from each line
mapping each key to a stable Prometheus metric name
assigning an appropriate metric type (typically
gauge)
StoredSafe does not store state or counters for Prometheus. All interpretation and normalization is performed outside the appliance.
High-level steps
Deploy snmp_exporter on a host that has network access to the StoredSafe appliance.
Configure an SNMPv3 authentication profile using authPriv on StoredSafe. Only SNMPv3 with authPriv is supported.
Define an SNMP module in snmp_exporter that polls metrics via
NET-SNMP-EXTEND-MIB::nsExtendOutLine."metrics".Parse and map each returned line into numeric Prometheus metrics (one metric per line, with explicit type and naming).
Configure Prometheus to scrape snmp_exporter and add Prometheus as a data source in Grafana.
Notes
Prefer
nsExtendOutLine. It returns one metric per line and avoids multi-line parsing.Align the polling interval with the audit cadence. The internal audit process runs at a fixed interval controlled by the appliance (typically every 5 minutes) and cannot be changed by the customer. A polling interval of 300 seconds (or slightly higher) is therefore recommended to avoid collecting duplicate samples.
For large environments, avoid overly frequent polling and consider staggering polls across targets to reduce SNMP load.
Sample snmp_exporter configuration (copy/paste)
The example below uses nsExtendOutLine and the extend name metrics.
In practice, customers usually extract a subset of metrics used for dashboards and
alerts (for example: ok, backup health, audit freshness, DB health, RAID health).
Note
The example below demonstrates how SNMP extend output is collected. In practice, customers typically map individual lines to dedicated Prometheus metrics rather than exporting the raw extend output.
snmp.yml (illustrative):
auths:
  storedsafe_v3:
    version: 3
    security_level: authPriv
    username: "YOUR_SNMPV3_USER"
    auth_protocol: "SHA"
    password: "YOUR_AUTH_PASSWORD"
    priv_protocol: "AES"
    priv_password: "YOUR_PRIV_PASSWORD"

modules:
  storedsafe_metrics:
    walk:
      # NET-SNMP-EXTEND-MIB::nsExtendOutLine."metrics"
      - 1.3.6.1.4.1.8072.1.3.2.4.1.2
    metrics:
      - name: storedsafe_extend_line
        oid: 1.3.6.1.4.1.8072.1.3.2.4.1.2
        type: DisplayString
        help: "Net-SNMP extend output lines for token 'metrics'"
Prometheus scrape config (example):
scrape_configs:
  - job_name: "storedsafe-snmp"
    metrics_path: /snmp
    params:
      auth: [storedsafe_v3]
      module: [storedsafe_metrics]
    static_configs:
      - targets:
          - 192.0.2.10   # StoredSafe SNMP agent address
This illustrative configuration exports raw extend output as a string and must be combined with a parsing/mapping step to produce numeric Prometheus metrics.
Option B: Telegraf SNMP input -> Prometheus/InfluxDB -> Grafana
Telegraf can poll SNMPv3 targets and transform fields using processor plugins. This is useful when string values must be parsed and converted to numeric fields.
High-level steps
Deploy Telegraf and configure SNMPv3 credentials.
Poll StoredSafe extend output (prefer
nsExtendOutLine."metrics").Extract the numeric value from each
key valueline and store it in a numeric field.Export to Prometheus (Telegraf Prometheus output) or to InfluxDB, and visualize in Grafana.
Grafana / Prometheus FAQ
What do I need to run?
To visualize StoredSafe metrics in Grafana, you need:
StoredSafe exposes metrics exclusively via SNMPv3 using the authPriv security level. Credentials are configured by a system administrator in the StoredSafe management console.
One of the following bridges: - Prometheus
snmp_exporter(recommended), or - Telegraf with SNMP input and parsing/processing.Grafana connected to Prometheus or InfluxDB.
No CLI or operating system access to the StoredSafe appliance is available to customers. All configuration, including SNMPv3 credentials, is performed via the StoredSafe management console.
Some metrics (for example uptime_s or deleted_vaults_total) are cumulative and typically
monotonic, but they are exposed as gauges. No metrics rely on Prometheus counter semantics or reset detection.
Which SNMP version is supported?
Only SNMPv3 is supported for metrics access.
Supported security level:
- authPriv (authentication and encryption)
Note
authPriv is mandatory to ensure confidentiality and integrity of
management data in transit. StoredSafe does not support unauthenticated
or unencrypted SNMP access, as metrics may reveal sensitive operational
state and system health information.
SNMPv1, SNMPv2c, and SNMPv3 without privacy (authNoPriv) are not supported.
How often should I poll metrics?
Recommended polling interval:
300 seconds (or slightly higher) for normal environments
300–600 seconds for large environments with many targets
Polling more frequently than the audit interval does not provide additional information and is not recommended.
Polling does not affect audit cadence, backups, or system state.
What does the ok metric mean?
ok is a computed, high-level health indicator:
ok = 1means the system is healthy.ok = 0means immediate attention is required.
ok represents whether all mandatory operational requirements are currently met.
Mandatory backup failures will force ok = 0, as will other critical conditions
such as stale auditing, database failures, or RAID/drive health issues.
How should I alert on backups?
Backups are mandatory and should always be monitored.
Recommended alert conditions:
backup_completed_ok == 0(critical)backup_transfer_ok == 0(critical)
Optional additional alerts:
backup_completed_age_sexceeds your operational thresholdbackup_transfer_age_sexceeds your operational threshold
How do I detect if auditing has stopped?
Use the audit freshness metric:
audit_stale_s
Recommended alert:
audit_stale_s > 900seconds (15 minutes)
Why are metrics returned as text?
Metrics are exposed via Net-SNMP extend and intentionally use a simple
key value format to remain compatible with SNMP-based monitoring systems.
Prometheus alerting examples
The expressions below assume metrics are exported into Prometheus with a
storedsafe_ prefix.
Overall health
storedsafe_ok == 0
Mandatory backups
storedsafe_backup_completed_ok == 0
storedsafe_backup_transfer_ok == 0
Audit freshness
storedsafe_audit_stale_s > 900
Database health
storedsafe_db_ok == 0
Optional latency threshold:
storedsafe_db_latency_ms > 200
Backup footprint (optional)
storedsafe_backup_occupies_bytes > 0
Storage / RAID
storedsafe_raid_ok == 0
storedsafe_failed_drives > 0
storedsafe_critical_drives > 0
storedsafe_degraded_drives > 0
Warnings and violations
storedsafe_warnings > 0
storedsafe_violations > 0
Licensing (optional)
storedsafe_active_users > storedsafe_licensed_users
This condition will also result in storedsafe_violations == 1.